2018 - 01 - 16 (화)
한국지도 데이터 시각화
- SHP 파일 다운로드 : http://www.gisdeveloper.co.kr/?p=2332
- 웹에서 SHP 파일의 지도를 보여주기 위해서는 GeoJSON 이라는 형태로 변환할 필요가 있다.
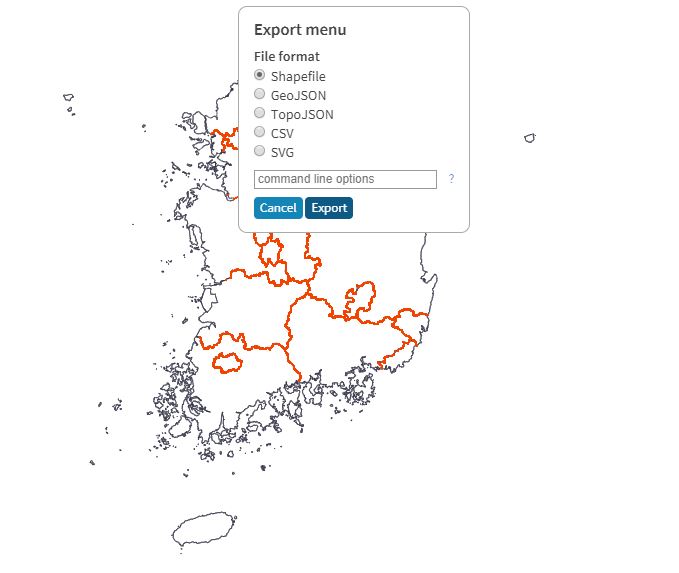
- geoJSON , Shapefile, TopoJson , CSV 형태로 변환 : http://mapshaper.org/
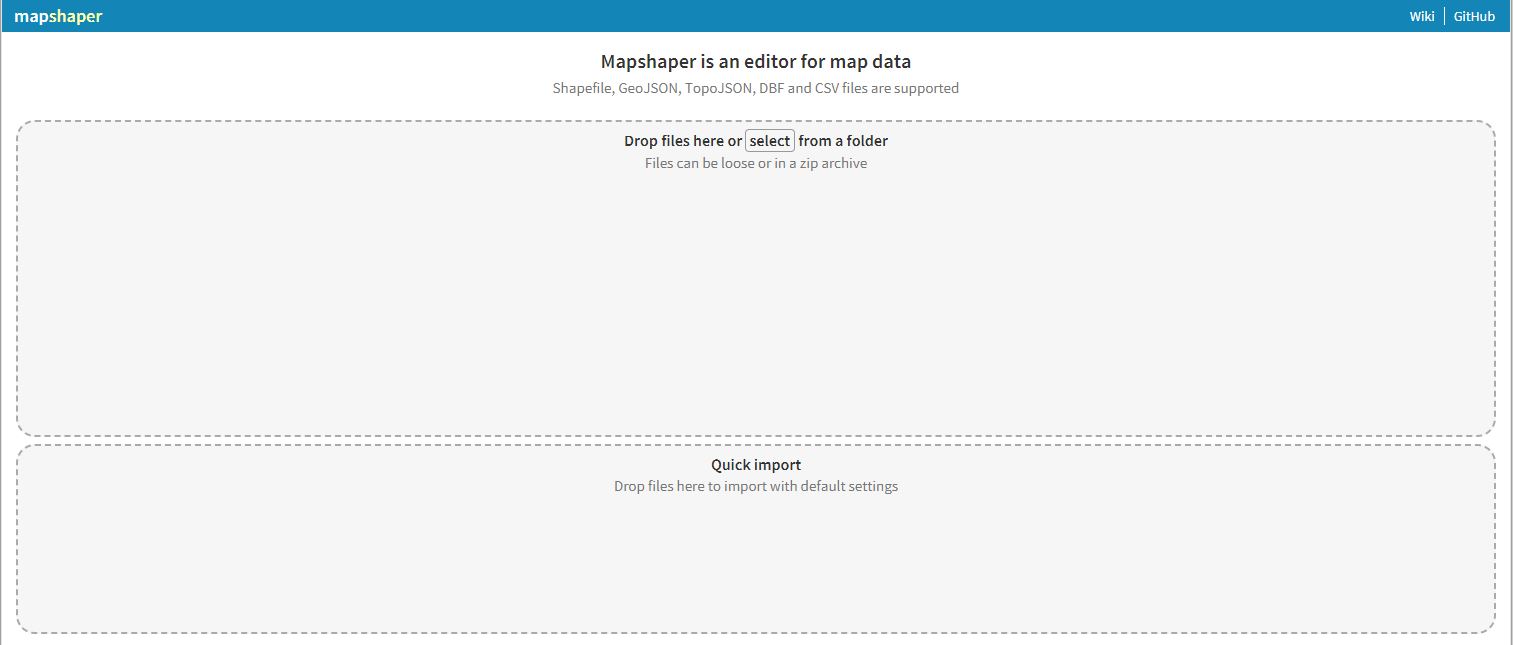
위 화면이 뜨면 쉐이프파일을 넣고 아래와같이 필요한 형태로 변환을 한다.
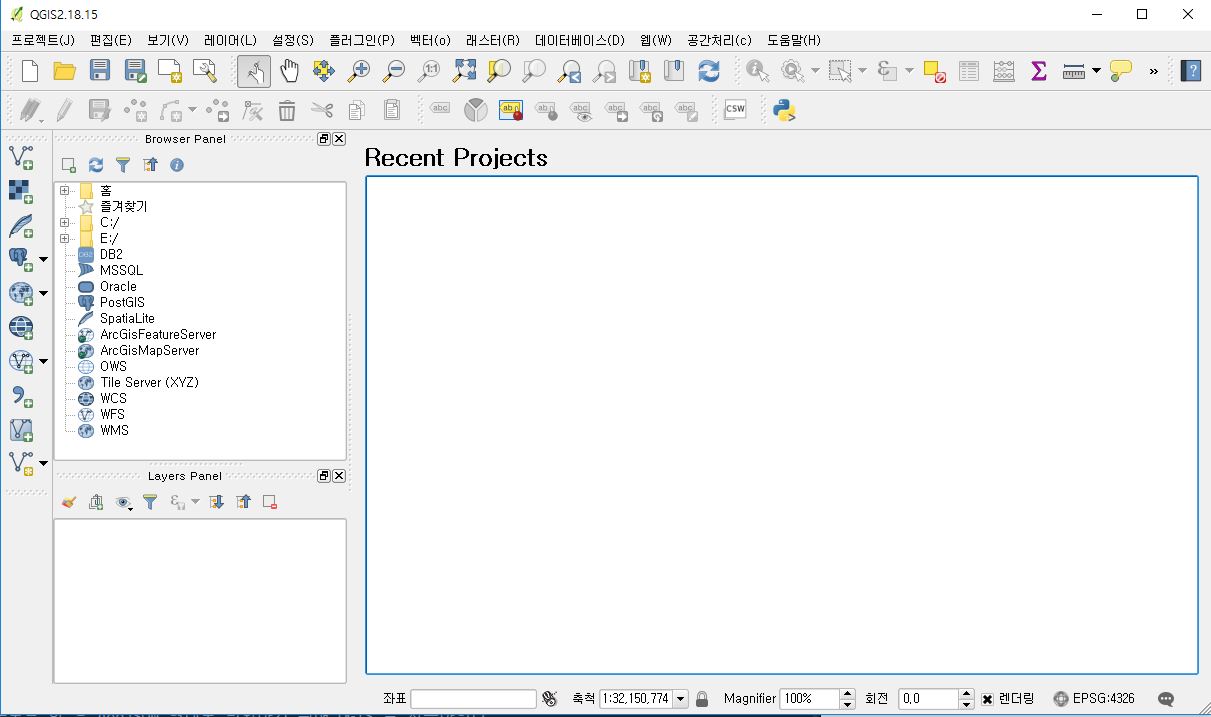
mapshaper 사용을 하지 않는 방식으로는 SHP 파일을 다운로드 한 후 geoJSON 형태로 변환하기 위해 QGIS 를 사용하였다.
- QGIS 다운로드 : https://www.qgis.org/ko/site/forusers/download.html
- 사용 영상 : https://www.youtube.com/watch?v=6oG8j9CZFpw
위와같은 방식으로 geoJSON 을 얻었다면 해당 파일을 활용하여 데이터 시각화를 진행할 수 있다.
- 지도를 활용한 데이터 시각화 하기 위해 참고한 사이트 : http://codefactory.kr/2013/05/17/korea-map/
-
위 사이트에 있는 예제를 활용하여서 데이터 시각화를 진행하였으며, D3.js 를 활용하였다. [D3.js : https://d3js.org/ ] [D3.js example : https://github.com/d3/d3/wiki/Gallery ]
-
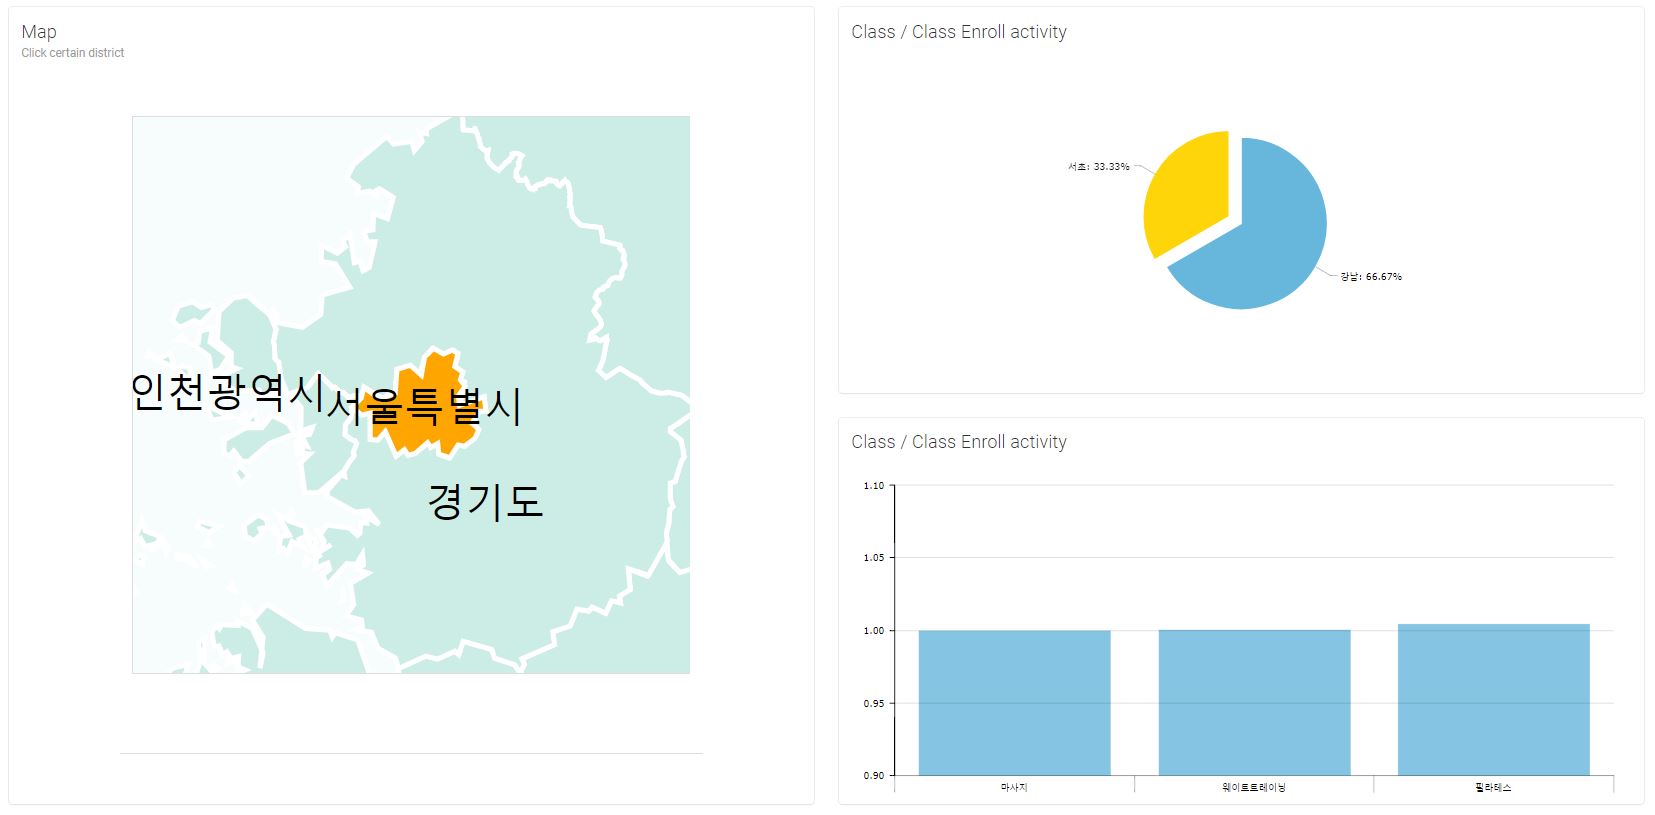
위 예제에서 변형시킨 것은 특정 지역을 클릭했을 때 클릭 이벤트의 매개변수인 d ( json Object ) 값의 properties.Name 으로 지역명을 받아 컨트롤러를 통해 AJAX 를 활용하여 가변적인 데이터 시각화를 해보았다.
아래 보이는 차트는 특정 지역의 클릭이 활성화되지 않은경우의 차트 상태이다. (전체 지역단위의 차트를 보여준다.)
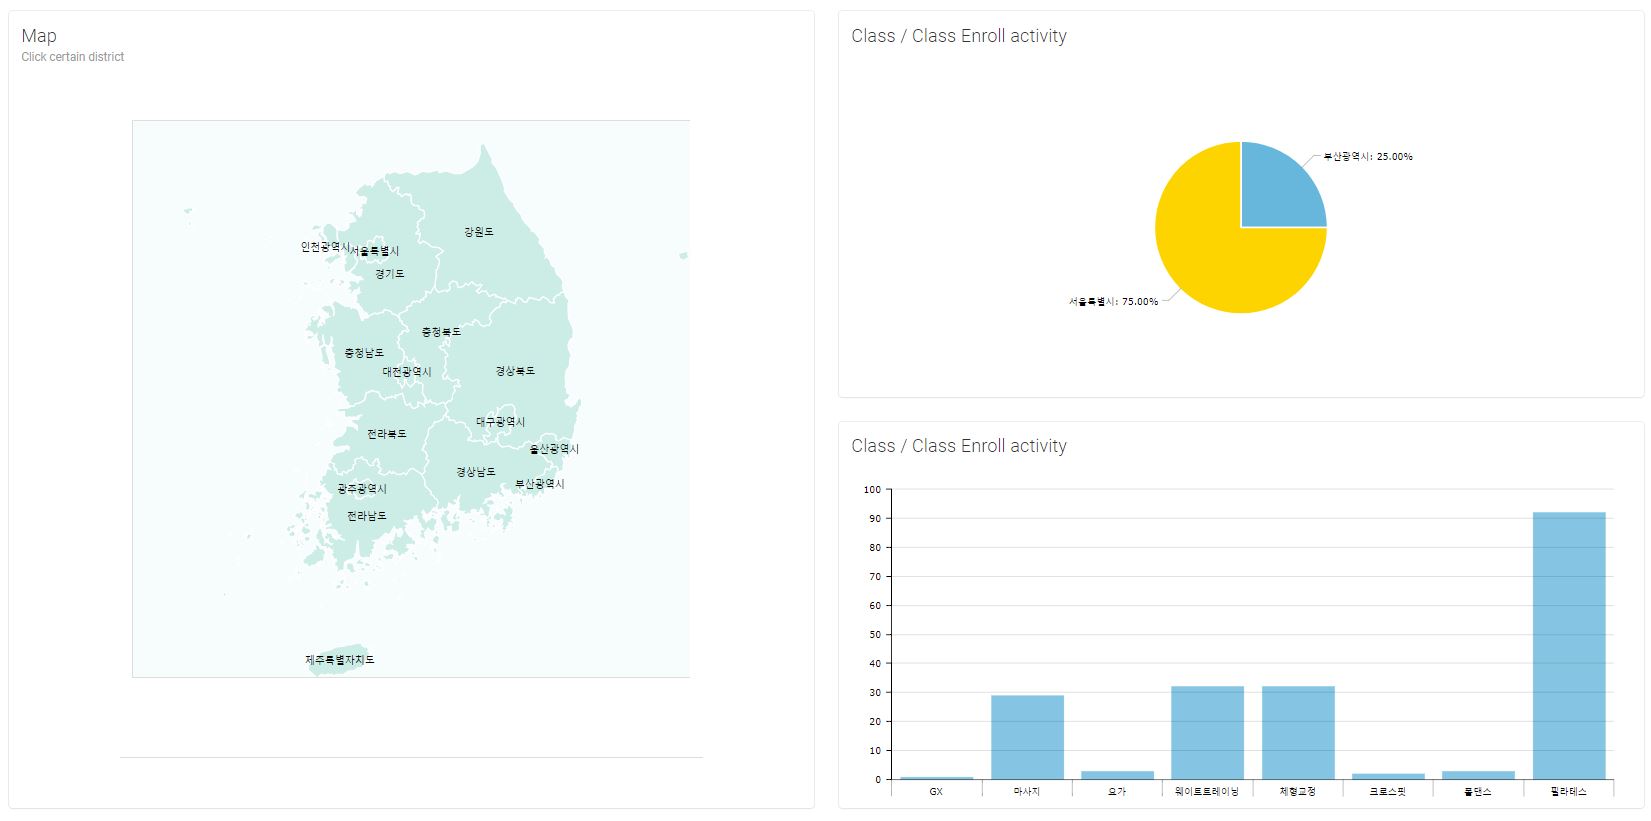
특정 지역을 클릭 했을 때는 클릭한 지역의 데이터를 기반으로한 차트를 생성한다.
- 참고할 만한 소스코드
기존의 d3.js 를 변형하였다.
function click(d) {
  var x, y, k;
  console.log(d.properties.Name)
  console.log(typeof(d.properties.Name));
		var postData = {"country" : d.properties.Name}


  if (d && centered !== d) {
    var centroid = path.centroid(d);
    x = centroid[0];
    y = centroid[1];
    k = 4;
    centered = d;


	$.ajax({

		type : "POST",
	    url: "/admin/categoryCountryBar",
	    data: postData,
	    success: function(data) {

	    	$("#chartAllCategory").css("display", "none");
	    	$("#chartCategory").css("display", "");
			console.log(data)
	    	var chart = AmCharts.makeChart( "chartCategory", {
	  		  "type": "serial",
	  		  "theme": "light",
	  		  "dataProvider": data,
	  		  "gridAboveGraphs": true,
	  		  "startDuration": 1,
	  		  "graphs": [ {
	  		    "balloonText": "[[category]]: <b>[[value]]</b>",
	  		    "fillAlphas": 0.8,
	  		    "lineAlpha": 0.2,
	  		    "type": "column",
	  		    "valueField": "count"
	  		  } ],
	  		  "chartCursor": {
	  		    "categoryBalloonEnabled": false,
	  		    "cursorAlpha": 0,
	  		    "zoomable": false
	  		  },
	  		  "categoryField": "categoryName",
	  		  "categoryAxis": {
	  		    "gridPosition": "start",
	  		    "gridAlpha": 0,
	  		    "tickPosition": "start",
	  		    "tickLength": 20
	  		  },
	  		  "export": {
	  		    "enabled": true
	  		  }

	  		} );
	    }
	})


    $.ajax({
	    url: "/admin/classCountryCircle",
		type : "POST",
	    data: postData,
	    success: function(data) {
	    	console.log(data.length)
	    	if(data.length== 0){
	    		$(".noData").css("display","")
		    	$("#chartDistrict").css("display","none");
		    	$("#chartCity").css("display", "none");

	    	}else{

		    	$(".noData").css("display","none");
		    	$("#chartCity").css("display", "");
		    	$("#chartDistrict").css("display","none");
		    	var chart = AmCharts.makeChart( "chartCity", {
		    		  "type": "pie",
		    		  "theme": "light",
		    		  "dataProvider": data,
		    		  "valueField": "count",
		    		  "titleField": "country",
		    		   "balloon":{
		    		   "fixedPosition":true
		    		  },
		    		  "export": {
		    		    "enabled": true
		    		  }
		    		} );

	    	}
	    }
	})

  } else {
    x = width / 2;
    y = height / 2;
    k = 1;
    centered = null;
	$("#chartCity").css("display","none");
	$("#chartDistrict").css("display","");
	$(".noData").css("display","none")
	$("#chartCategory").css("display", "none")
	$("#chartAllCategory").css("display", "")
  }

  states.selectAll("path")
      .classed("active", centered && function(d) { return d === centered; });

  states.transition()
      .duration(1000)
      .attr("transform", "translate(" + width / 2 + "," + height / 2 + ")scale(" + k + ")translate(" + -x + "," + -y + ")")
      .style("stroke-width", 1.5 / k + "px");
}
var width = 700,
height = 700,
initialScale = 5500,
initialX = -11900,
initialY = 4050,
centered,
labels;

var projection = d3.geo.mercator()
.scale(initialScale)
.translate([initialX, initialY]);

var path = d3.geo.path()
.projection(projection);

var zoom = d3.behavior.zoom()
.translate(projection.translate())
.scale(projection.scale())
.scaleExtent([height, 800 * height])
.on("zoom", zoom);

var svg = d3.select("#container").append("svg")
.attr("width", width)
.attr("height", height)
.attr('id', 'map');

var states = svg.append("g")
.attr("id", "states")
.call(zoom);

states.append("rect")
.attr("class", "background")
.attr("width", width)
.attr("height", height);

d3.json("../../../resources/chart/data/korea.json", function(json) {
states.selectAll("path")
  .data(json.features)
.enter().append("path")
  .attr("d", path)
  .attr("id", function(d) { return 'path-'+d.id; })
  .on("click", click);

labels = states.selectAll("text")
.data(json.features)
.enter().append("text")
  .attr("transform", labelsTransform)
  .attr("id", function(d) { return 'label-'+d.id; })
  .attr('text-anchor', 'middle')
  .attr("dy", ".35em")
  .on("click", click)
  .text(function(d) { return d.properties.Name; });
});
- 유동적인 차트를 보여주기 위한 컨트롤러
@RequestMapping(value = "/classCircle", method = RequestMethod.POST)
@ResponseBody
public List classCircle()throws Exception {
  System.out.println("A");
  List<PlaceObj> countryCount = adminService.getCountryCount();
  ArrayList response = new ArrayList();
  for(int i =0; i < countryCount.size(); i ++) {
    HashMap<String , Object> map = new HashMap<String, Object>();
    map.put("country", countryCount.get(i).getPlace_country());
    map.put("count", countryCount.get(i).getCountry_count());
    response.add(map);
    System.out.println(map);
    System.out.println(response);
  }
  System.out.println(response);
  return response;

}


@RequestMapping(value = "/classCountryCircle", method = RequestMethod.POST)
@ResponseBody
public List classCountryCircle(@RequestParam("country") String country)throws Exception {
  System.out.println(country);

  List<PlaceObj> cityCount = adminService.getcityCount(country);
  ArrayList response = new ArrayList();
  for(int i =0; i < cityCount.size(); i ++) {
    HashMap<String , Object> map = new HashMap<String, Object>();
    map.put("country", cityCount.get(i).getPlace_city());
    map.put("count", cityCount.get(i).getCity_count());
    response.add(map);
    System.out.println(map);
    System.out.println(response);
  }
  return response;

}
@RequestMapping(value = "/categoryCountryBar", method = RequestMethod.POST)
@ResponseBody
public List categoryCountryBar(@RequestParam("country") String country)throws Exception {
  System.out.println(country);

  List<JsonObj> categoryCountryBar = adminService.categoryCountryBar(country);
  ArrayList response = new ArrayList();
  for(int i =0; i < categoryCountryBar.size(); i ++) {
    HashMap<String , Object> map = new HashMap<String, Object>();
    map.put("categoryName", categoryCountryBar.get(i).getCategory());
    map.put("count", categoryCountryBar.get(i).getCategory_count());
    response.add(map);
    System.out.println(map);
    System.out.println(response);
  }
  return response;

}
@RequestMapping(value = "/categoryBar", method = RequestMethod.POST)
@ResponseBody
public List categoryBar()throws Exception {

  List<JsonObj> categoryCount = adminService.categoryCount();
  ArrayList response = new ArrayList();
  for(int i =0; i < categoryCount.size(); i ++) {
    HashMap<String , Object> map = new HashMap<String, Object>();
    map.put("categoryName", categoryCount.get(i).getCategory());
    map.put("count", categoryCount.get(i).getCategory_count());
    response.add(map);
    System.out.println(map);
    System.out.println(response);
  }
  return response;

}